
Google Analytics For Ecommerce Stores: How To Get Started
If your ecommerce brand doesn’t have a Google Analytics account, you’re missing out. Use these step-by-step instructions to get started ASAP.

Written by Lauren Hall
If your ecommerce company doesn’t have a Google Analytics account, you’re missing out. GA is a free and easy way to track and monitor the visitors that come to your website and app. You’ll get valuable and specific insights that you can use to inform future marketing initiatives, including SEO and paid campaigns.
Measuring and tracking data in Google Analytics for your ecommerce store will also give you a deeper understanding of the performance and effectiveness of your current marketing campaigns. It allows you to better serve your customers and visitors because you’re able to identify what resonates with them.
Here's what we'll cover in our guide:
Get our best content on ecommerce marketing in your inbox 2 times a week
What is Google Analytics?
Google Analytics (GA) is a free analytics tool offered by Google that lets you collect customer-related data from your websites and apps. GA tracks this data using a tracking code, called a tag, unique to your GA profile and website.
Ecommerce sales accounted for over 13% of retail sales in 2021. Google is mindful of ecommerce’s popularity and built GA4 with online retailers in mind. GA4 is completely event driven. An event is any type of interaction that your customers have with your website or app. A “page view” event, for example, is triggered any time a user views a page on your website. You can use GA4’s events, create your own, or both.
Events help ecommerce companies by showing you how your users engage with your products, which products your new users view most, which products generate the most revenue, and more. Use this information to learn everything you can about your users – their behaviors, patterns, and what resonates most with them. Then you can improve your marketing efforts to reach your target audience more effectively.
How to set up Google Analytics
Creating a Google Analytics account is easy. We’ll walk you through setting up an account, step by step.
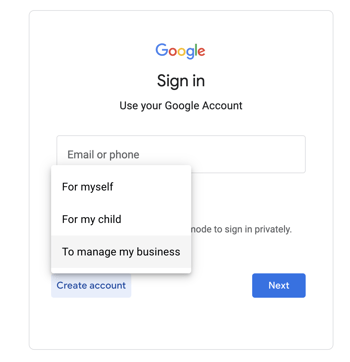
Step 1: Sign up for a Google account
If you don’t have a Google account yet or want to create a separate one for your business, you’ll need to do that first. Go to the Google homepage and click the button in the top right corner. (If you already have a business Google account, move on to Step 2.)
You can either create a Gmail email address or use an existing email address already associated with your business.
Step 2: Sign up for Google Analytics
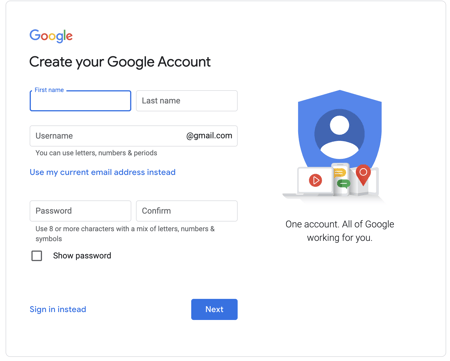
Next, if you haven’t already done so, you’ll need to create a Google Analytics profile. Visit www.analytics.google.com to start and click the “Start measuring” button.
First, you’ll set up an account for your business. Your account is the access point to view all your metrics.
All you need to do at this step is enter your account name, typically the name of your business.
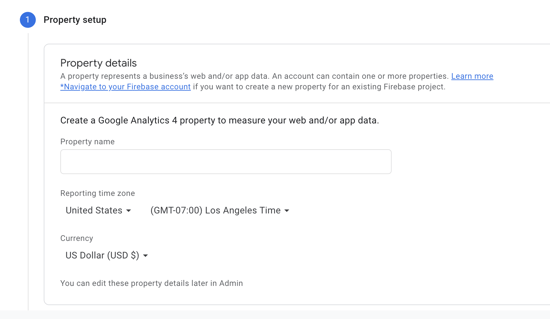
Step 3: Create a property
Next, you’ll create a property. From your property (or properties), Google Analytics is able to process your website and app’s data to send you the information.
One of the major changes in Google Analytics 4 is that a single property can track visits on all the pages of your website and app. In GA4, Google recommends keeping related data together in one property: “If data should generally be analyzed together (product line, brand, application), data should be in one property.” You don’t have to connect other subdomains or landing page URLs to GA4 like you did in Universal Analytics – one property tracks all of it for you. For most small to mid-size ecommerce stores, that means you only need one property for your website and app(s).
On the other hand, if your company manages many brands, you may consider setting up a different property for each brand. If you need to create a second property (or more), you can do that once you’ve set up this first property.
Step 4: Add a data stream
Each property has streams of data that collect user information from your app or website. GA4 tracks and gathers data from your data streams to send back to the property (or properties) you created in Step 3.
Data streams have a much different function than their predecessor in Universal Analytics, views. Best practices in Universal Analytics were to set up a view for each different subdomain, landing page, ad campaign, and more. In GA4, Google recommends just 3 data streams per property:
- 1 web data stream per property (a website)
- 1 iOS data stream per property (an iOS app)
- 1 Android data stream per property (an Android app)
According to Google, “Data streams are not the equivalent of views in Universal Analytics and should not be used to separate data.” If you use data streams to separate data on your websites and app, you’ll limit your ability to see the full user journey across both your website and app(s).
Each data stream has its own unique identifier: a Measurement ID (for a website) or SDK (software development kit) setup instructions (for an app). You’ll need this information to start collecting data.
Step 5: Collect data from your website and app
Now you’re ready to start collecting data. There are 2 different processes for collecting data: one from your website and one from your apps.
How to collect data on your website from GA4
To collect data from your website, you need tags. Tags are codes, or tracking scripts, that you add to your website so that Google Analytics can track the data. There are two different ways to use tags.
- A global site tag (referred to as gtag.js) is the tracking code that is unique to your Google Analytics accounts. Most ecommerce companies use a global site tag when they have a website builder, like Wix or WordPress.
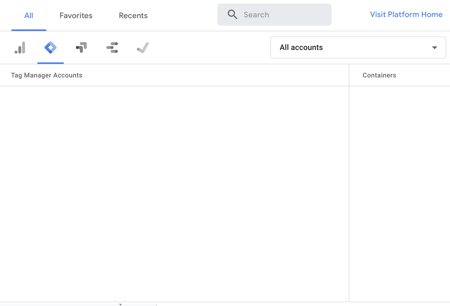
- Google Tag Manager is a tag manager solution from Google that collects data from your website. Tag Manager and gtag.js both have similar functions. Google Tag Manager enables you to manage and update all your tags in one spot. You can access Google Tag Manager from your Analytics dashboard.
In Universal Analytics, the tracking code only automatically tracked page views. In GA4, the tracking code automatically tracks page views plus scrolls, site search, video engagement, outbound clicks, and file downloads. All other events or interactions need to be manually configured via a global site tag or Google Tag Manager.
You should use Google Tag Manager if you integrate with other tools or platforms on your website or apps, like Shopify or Google Ads, or if you want the ability to quickly and easily test any new tags. It’s a more robust and direct way to manage your tags and deploy them yourself, without involving a developer.
However, if your website isn’t integrated with other tools or if you need to install the tags directly on your website, you may consider using the global site tag.
How to collect data from your apps from GA4
To start collecting data from your apps, you’ll need to add the Google Analytics for Firebase (GA4F) SDK to your app. You’ll need to do this for both iOS and Android apps – each will have its own SDK.
With your unique SDK in place, GA4 will automatically track several events like the number of logins, number of active users, purchases, ad impressions, and more.
Google Analytics reports and how to use them
In GA4, some reports are grouped in sets called collections. The reports are still in the same spot as they were in Universal Analytics, on the left-hand side. You’ll see a reports snapshot, real-time reports, the life cycle collection, and the user collection.
Realtime
Realtime reports let you monitor activity in your data streams as it happens. Realtime reports show you how many users are on your app or website and other actions they’re taking.
There are a few ways to use Realtime reports as an ecommerce company to track performance and measure data:
- To check on short-term (one- or two-day) promotion activity, like a social media campaign, to see if it’s driving traffic to your website or app. You can also see which pages have the most views during any given campaign.
- To track the immediate effects of a blog or social post on website or app traffic.
- To see if people are looking at new or recently changed content on your website.
You can filter your report to see how many users are new as compared to returning.
Life cycle collection
The Life cycle collection has reports that help you understand user activity from acquisition to conversion. Here are the reports you’ll see in the Life cycle collection:
Acquisition reports
Acquisition reports show you where both new and returning users to your website come from. For example, you can see how many users found your website through organic search vs. paid search.
When you can see where your users are coming from, you can optimize those channels. For instance, if you notice a lot of your new customers are coming from social, create a content plan with social media posts that are specifically geared toward new users – like demo and explainer videos about your product or an FAQ page. If they’re finding you through organic search, you can do top-of-the-funnel keyword research to write SEO-optimized blog posts.
Engagement reports
Engagement reports show you how your users engage with your website or app. Engagement includes the number of times users engage, how often users return, and the number of users who view a certain product.
Ecommerce companies can use engagement reports in a number of ways. It mostly depends on your goals. If you’re focusing on organic traffic and want to write more search-optimized content for your website, look at the pages that your users engage with most. Look for the blogs that users have spent the most time on or visited the most. Try to identify why your users engage with the pages they engage with. Then create more content around those topics to drive more traffic.
This is also a great way for ecommerce companies to see the most highly trafficked product pages. If you notice that a lot of users are visiting a certain product but not buying it, try to identify why. Is it the price, the product details, or is there not enough information? You can test your hypothesis (lowering the price or including more product details, for example) and then monitor the results on GA to continuously optimize your website or app and drive more business.
Monetization reports
Monetization reports help you see the revenue you generate from your website or app. Within the monetization reports, you can track and measure sales from your products and any user interactions with them. You can monitor and track website purchases, in-app purchases, app subscriptions, and publisher ads.
Ecommerce companies can use these reports to see which products have generated the most revenue on your website, what percentage of your app revenue is from ads, and more. If you know which of your products generate the most revenue, you can focus on promoting those products through paid ads or social campaigns.
Retention reports
Retention reports allow you to see how effectively you’re able to turn new users into returning users, plus the number of users who keep returning. These reports are helpful in understanding why users return and what pages or products your returning users engage with most.
One way to use this report is to see where most new users land and optimize that page for users at the top of your buying funnel or direct them to a page specifically for top-of-the-funnel customers, like an FAQ page or your blog page. These reports can also show you how valuable new users are based on the revenue you generate from their first visit.
User collection
The User collection helps you learn about the people who use your site or app. There are two reports within this collection: demographics and tech.
Demographics reports
Demographics reports let you see users by age, location, interests, and more. This can be really helpful when you’re planning ad and social campaigns. If a certain user demographic is viewing a specific product, you can target ads for that product toward that demographic.
For instance, if you’re a clothing store and you see a lot of users ages 18–25 are interested in, and visiting pages for, your shoe line, you can create ads that are targeted to them with visuals and messaging that resonates with them.
Tech reports
Tech reports show you traffic reports grouped by the technologies people use to visit your site and app. The data for this report is collected automatically when you connect your website and/or app to Google Analytics.
This information is helpful for your developers, so they can ensure that your website is compatible with the browsers and operating systems your visitors use. You can also use this report to see which devices your visitors use to visit your site. If the majority of your visitors are using a mobile app, you want to make sure the site is optimized for mobile viewing.
Make the most out of customer data with GA4
Google Analytics opens the door to valuable insights into your customers’ behaviors, preferences, and profiles. But more important than access to this information is what you do with it.
You’re set up with a Google Analytics account, and you’re equipped with the basics. Now, you have to continuously monitor, test, and optimize your ecommerce website so you can acquire new users and increase sales. Check out our resources on how to build a high-performing landing page and how to drive more traffic to your website so you can take full advantage of GA4.
Writen by Lauren Hall

Lauren is a Brand Marketing Associate at Privy. She's the brains behind all things content. When she's offline, she's obsessing over her Bernedoodle pup, Monster, and plotting ways to being a full-time Vermonter ASAP.
You may also like to read
Learn how we responsibly build, test, and refine AI models and capabilities to ensure accuracy and domain relevancy.
Privy 3.0: More Than Popups. How Privy Helps Independent Shopify Stores Win.
Think you know Privy? Think again. Privy 3.0 is here. And it’s WAY more than popups. Intuitive, powerful email and SMS marketing. Here's what we're up to.
Create authentic urgency and exclusivity with locked website launches
A locked website launch is a highly effective way to create exclusivity and drive urgency with your email & SMS subscribers. Get tips on how you can try this play in 3 simple steps.
The Two-Way Email Marketing Strategy
Building authentic relationships through your email marketing is the best way to ensure your subscriber base remains engaged over time. Learn how to build a conversational email strategy today.